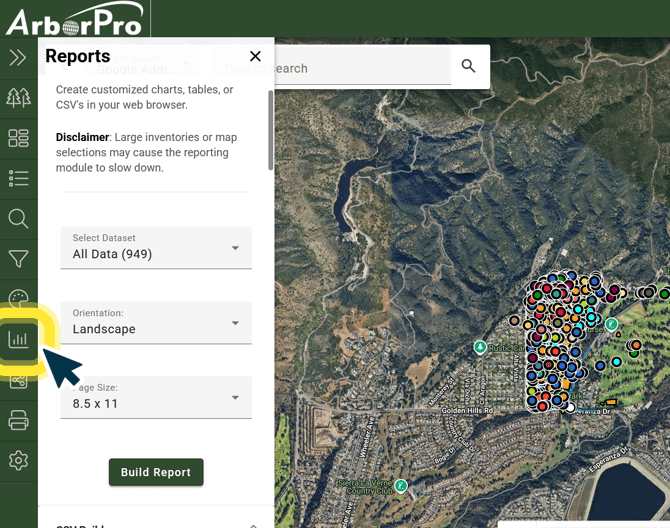
The reports pane allows you to generate, customize, and export CSV and PDF reports based on your defined datasets. You can use the Filter Tool, Groups, or Map Selection to choose the data you want included.
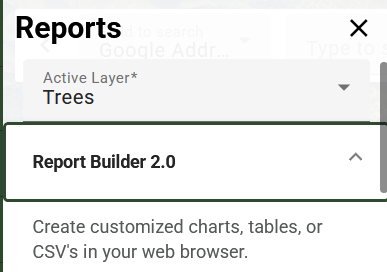
Selecting Report Builder 2.0 creates customized, formatted, presentation-ready reports designed for PDF viewing. Includes summaries, tables, and visual elements for deliverables and presentations.
Step 1.) Open the Reports Pane
Navigate to the Reports Pane, represented by the bar-graph icon, from your Data Analysis toolbar.
Step 3.) Format your Report
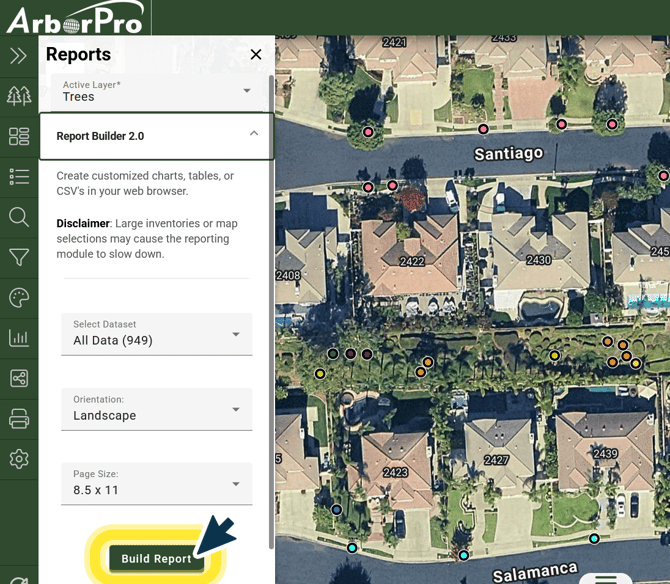
Begin to select your desired dataset, page orientation, and page size using the available dropdown options.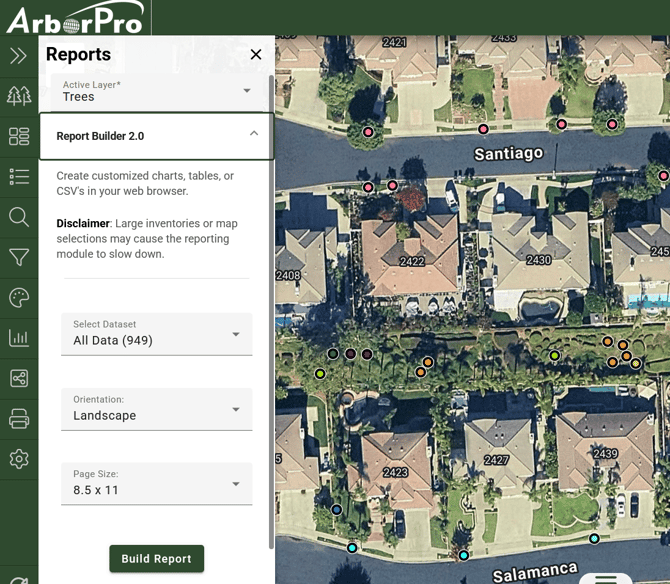
Step 4.) Click Build Report
After confirming your formatting settings, click the green “Build Report” button. A new page will open and a ‘Report Summary’ chart of the Dataset you’ve selected.
Step 5.) Customize your Report Chart
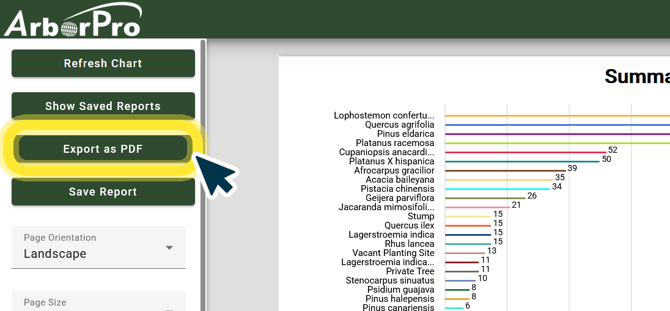
Using the fields on the left-hand side, add a title and labels, then use the ‘Advanced Tools’ dropdown menu to customize the visual appearance of your chart.
ArboPro Tip: Not seeing an update after making changes? Click the green “Refresh Chart” option to see your updated graphic after changes have been made.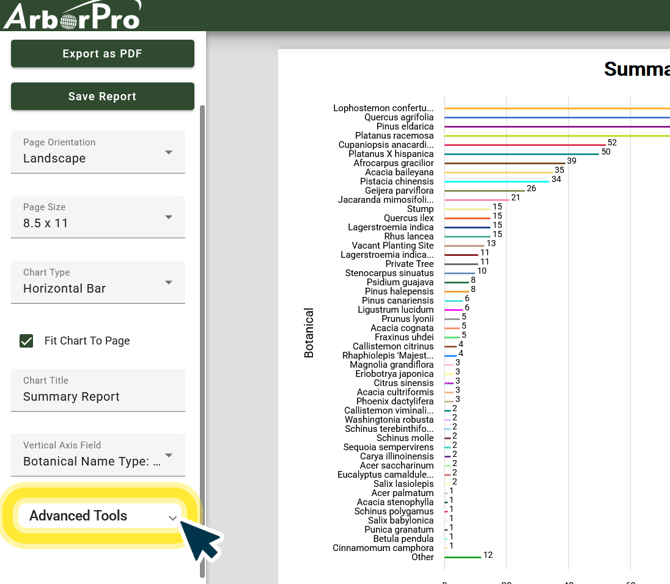
Step 6.) Export
Once you’ve finalized your report’s summary chart settings, click the green “Export as PDF” button to download the file to your device.
ArboPro Tip: If you would like to come back to edit your report later, click the green, “Save Report” Button. You can access all saved reports when click the “Show Saved Reports” button above.